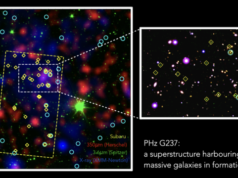
The image is a compotie of the i-band data (in red) from the Hyper Suprime-Cam at the Subaru Telescope and R-band (in green) and V-band (in blue) images from the Mayall 4-m telescope at the Kitt Peak National Observatory of National Optical Astronomy Observatory. Contour lines show the mass distribution. Red and blue circles show galaxies that stopped star formation and galaxies with star formation, respectively. The research team was able to study the evolution of the large scale structure in the Universe by comparing the mass distribution in the Universe and the distribution of the galaxies.Credit: Hiroshima University/NAOJ
Galaxies in the universe trace patterns on very large scales; there are large empty regions (called “voids”) and dense regions where the galaxies exist. This distribution is called the cosmic web. The most massive concentrations of galaxies are clusters. The formation of the cosmic web is governed by the action of gravity on the invisible mysterious “dark matter” that exists throughout the universe. The normal baryonic material one can see falls into the dark matter halos and forms galaxies. The action of gravity over about 14-billion-year history of the universe makes the halos cluster together. The location of galaxies or clusters in this enormous cosmic web tests our understanding of the way structure forms in the universe.
Increasingly, deeper and more extensive observations with telescopes like Subaru Telescope provide a clearer picture of the way galaxies evolve within the cosmic web. Of course, one cannot see the dark matter directly. However, one can use the galaxies that are seen to trace the dark matter. It is also possible to use the way the gravity of clusters of galaxies distort more distant background galaxies, weak gravitational lensing, as another tracer.
The Hiroshima group combined these two tracers: galaxies and their weak lensing signal to map the changing role of massive star-forming galaxies as the universe evolves.
Find your dream job in the space industry. Check our Space Job Board »
Weak lensing is a phenomenon that provides a powerful technique for mapping the changing contribution of star-forming galaxies as tracers of the cosmic web. The cluster of galaxies and surrounding dark matter halo act as a gravitational lens. The lens bends the light passing through from more distant galaxies and distorts the images of them. The distortions of the appearance of the background galaxies provide a two-dimensional image of the foreground dark matter distribution that acts as a huge lens. The excellent imaging of the Subaru Telescope covering large regions of the sky provides exactly the data needed to construct maps of this weak lensing.
Dr. Yousuke Utsumi, a member of Hyper Suprime-Cam building team and a project assistant professor at Hiroshima University, conducted a 1-hour observation of a 4-deg2 patch of sky in the direction of the constellation Cancer. Figure 1 shows a close-up view of a cluster of galaxies with the weak lensing map tracing the matter distribution. The highest peaks in the maps correspond the foreground massive clusters of galaxies that lie 5 billion light-years away.
To map the three-dimensional distribution of the foreground galaxies, spectrographs on large telescopes like the 6.5-meter MMT disperse the light with a grating. The expansion of the universe shifts the light to the red and by measuring this shift one measures the distances to the galaxies. Using spectroscopy places the galaxies in the cosmic web. The observations locate star-forming galaxies and those that are no longer forming stars.
Collaborators led by Dr. Margaret Geller (Harvard-Smithsonian Center for Astrophysics) conducted spectroscopic measurements for galaxies. The Hectospec instrument on the MMT enables measurements of redshifts for 250 galaxies at a time. The survey contains measurements for 12,000 galaxies.
The MMT redshift survey provides the map for the way all types of galaxies might contribute to the weak lensing map. Because the MMT survey provides distances to the galaxies, slices of the map at different distances corresponding to different epochs in the history of the universe can also be made and compared with the lensing map.
The MMT survey provides a predicted map of the cosmic web based on the positions of galaxies in three-dimensional space. Research team compared this map with the weak lensing map to discover the similarities. Figure 2 shows that both the highest peak and the largest empty regions are similar in the two maps. In other words, the matter distribution traced by the foreground galaxies and the distribution traced by the Subaru weak lensing map are similar. There are two complementary views of the cosmic web in this patch of the universe.
If they slice up the three-dimensional map in different redshift or time slices, they can examine the way the correspondence between these maps and the weak lensing map changes for different slices (Figure 3). Remarkably, the distribution of star-forming galaxies around a cluster of galaxies in the more distant universe (5 billion years ago) corresponds much more closely with the weak lensing map than a slice of the more nearby universe (3 billion years ago). In other words, the contribution of star-forming galaxies to the cosmic web is more prominent in the distant universe. These maps are the first demonstration of this effect in the weak lensing signal.
The research team provides a new window on galaxy evolution by comparing the three-dimensional galaxy distribution mapped with a redshift survey including star-forming galaxies to a weak lensing map based on Subaru imaging.
“It turns out that the contribution of star-forming galaxies as tracers of the mass distribution in the distant universe is not negligible,” said Dr. Utsumi. “The HSC weak lensing map should contain signals from more distant galaxies in the 8 billion-year-old universe. Deeper redshift surveys combined with similar weak lensing maps should reveal an even greater contribution of star-forming galaxies as tracers of the matter distribution in this higher redshift range. Using the next generation spectrograph for the Subaru Telescope, Prime Focus Spectrograph (PFS), we hope to extend our maps to the interesting era.”
Source: National Institutes of Natural Sciences
Research References:
- Yousuke Utsumi, Margaret J. Geller, Ian P. Dell’Antonio, Yukiko Kamata, Satoshi Kawanomoto, Michitaro Koike, Yutaka Komiyama, Shintaro Koshida, Sogo Mineo, Satoshi Miyazaki, Junya Sakurai, Philip J. Tait, Tsuyoshi Terai, Daigo Tomono, Tomonori Usuda, Yoshihiko Yamada, Harus J. Zahid. A WEAK LENSING VIEW OF THE DOWNSIZING OF STAR-FORMING GALAXIES. The Astrophysical Journal, 2016; 833 (2): 156 DOI: 10.3847/1538-4357/833/2/156


