A new study shows climate change may have contributed to the decline of Cahokia, a famed prehistoric city near present-day St. Louis. And it involves ancient human poop.
Published today [Feb. 25, 2019] in the Proceedings of the National Academy of Sciences, the study provides a direct link between changes in Cahokia’s population size as measured through a unique fecal record and environmental data showing evidence of drought and flood.
“The way of building population reconstructions usually involves archaeological data, which is separate from the data studied by climate scientists,” explains lead author AJ White, who completed the work as a graduate student at California State University, Long Beach. “One involves excavation and survey of archaeological remains and the other involves lake cores. We unite these two by looking at both kinds of data from the same lake cores.”
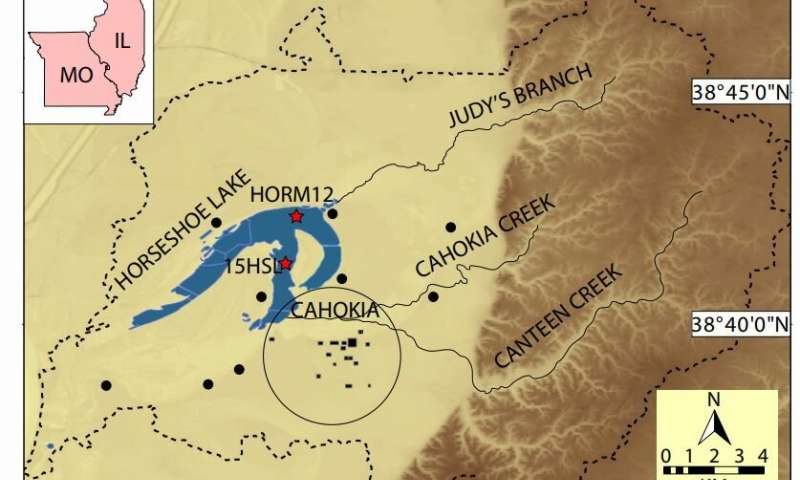
Last year, White and a team of collaborators—including his former advisor Lora Stevens, professor of paleoclimatology and paleolimnology at California State University, Long Beach, and University of Wisconsin-Madison Professor of Anthropology Sissel Schroeder—showed they could detect signatures of human poop in lake core sediments collected from Horseshoe Lake, not far from Cahokia’s famous mounds.
These signatures, called fecal stanols, are molecules produced in the human gut during digestion and eliminated in feces. As the people of Cahokia pooped on land, some of it would have run off into the lake. The more people who lived and defecated there, the more stanols evident in lake sediments.
Find your dream job in the space industry. Check our Space Job Board »
Because the sediments of a lake accumulate in layers, they allow scientists to capture snapshots of time throughout the history of a region through sediment cores. Deeper layers form earlier than layers found higher up, and all of the material within a layer is roughly the same age.
White found that fecal stanol concentrations at Horseshoe Lake rise and fall similarly to estimates of Cahokia’s population from better-established archaeological methods.
Schroeder, a scholar of the Cahokia area, says that excavations of the houses in and near Cahokia show human occupation of the site intensified around A.D. 600, and by 1100, the six-square-mile city reached its peak population. At the time, tens of thousands of people called it home.
Archaeological evidence also shows that by 1200, Cahokia’s population was on the decline and the site was abandoned by its mound-building Mississippian inhabitants by 1400.
Scientists have uncovered a number of explanations for its eventual abandonment, including social and political unrest and environmental changes.
For instance, in 2015, co-author Samuel Munoz, a former UW-Madison graduate student and now a professor at Northeastern University, was actually the first to collect one of the Horseshoe Lake sediment cores White used in his study and he found evidence that the nearby Mississippi River flooded significantly around 1150.
White’s latest study ties the archaeological and environmental evidence together.
“When we use this fecal stanol method, we can make these comparisons to environmental conditions that hither to now we haven’t really been able to do,” says White, now a Ph.D. student at UC Berkeley.
Using Munoz’s core and another White collected on Horseshoe Lake, the research team measured the relative amount of fecal stanols from humans present in sediment layers. They compared these to stanol levels known to come from bacteria in the soil in order to establish a baseline concentration for each layer.
They examined the lake cores for evidence of flooding and also looked for climate indicators that would inform them whether climate conditions were relatively wet or dry. These indicators, the ratio of a heavy form of oxygen to a light one, can show changes in evaporation and precipitation. Stevens explains that as water evaporates, the light form of oxygen goes with it, concentrating the heavy form.
The lake core showed that summer precipitation likely decreased around the onset of Cahokia’s decline. This could have affected the ability of people to grow their staple crop maize.
A number of different changes begin to happen in the archaeological record around 1150, Schroeder explains, including the number and density of houses and the nature of craft production.
These are all indicators of “some kind of socio-political or economic stressors that stimulated a reorganization of some sort,” she says. “When we see correlations with climate, some archaeologists don’t think climate has anything to do with it, but it’s difficult to sustain that argument when the evidence of significant changes in the climate shows people are facing new challenges.”
This has resonance today, she adds.
“Cultures can be very resilient in face of climate change but resilience doesn’t necessarily mean there is no change. There can be cultural reorganization or decisions to relocate or migrate,” Schroeder says. “We may see similar pressures today but fewer options to move.”
For White, the study highlights the nuances and complications common to so many cultures and shows how environmental change can contribute to social changes already at play.
Provided by: University of Wisconsin-Madison
More information: A.J. White el al. Fecal stanols show simultaneous flooding and seasonal precipitation change correlate with Cahokia’s population decline. PNAS (2019). www.pnas.org/cgi/doi/10.1073/pnas.1809400116
Image: Cahokia region and Horseshoe Lake watershed, shown as the black dashed line. Dark brown colors indicate higher topography, principally the river bluffs, and the yellow indicates the Mississippi River floodplain. Coring sites are indicated by red stars. The Cahokia complex is approximated by the large circle around black rectangles showing the position of some of the mounds at the site. Black dots show the locations of other sites with mounds within the Horseshoe Lake watershed that were occupied contemporaneously with Cahokia [∼1000–1400 CE]. Base map elevation data are derived from the National Elevation Dataset.
Credit: PNAS (2019). 10.1073/pnas.1809400116


