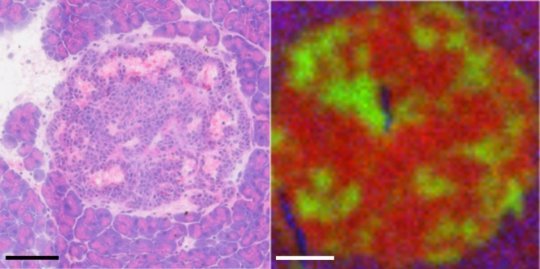
Cancer researchers struggle to identify tumor cells that are interspersed within nonmalignant tissues because tumor cells exploit the tissue environment and monopolize available resources to continue growing. Researchers attribute cancer cell’s ability to use cell signaling and metabolic pathways that override normal cell growth restrictions to complicated chemical exchanges between tissue and tumor cells. A new approach shows promise to begin analyzing cell-to-cell interactions in this complex environment.
Researchers at the University of Washington have demonstrated a new technique for mapping the flow of biomolecules in and around solid tumors. In a special issue of Biointerphases, an AVS journal from AIP Publishing, that is highlighting women in the field of biointerface science, the group uses time-of-flight secondary ion mass spectrometry (ToF-SIMS) to observe how molecules move and how tumors send signals to their microenvironment and sap local tissue of resources.
“People are going to see that this TOF-SIMS technique, when combined with knowledge of tumor cell behavior, will allow researchers to understand what’s happening on the chemical molecular level,” said Lara Gamble, an author on the paper. “Are there certain molecules, lipids or fuels that tumors suck away from regular tissues to help them grow?”
Tumor cells can draw in lipids from neighboring cells to help build bigger membranes and provide energy for bloated tumor cells. Blood vessels can become disrupted, leaving “blood lakes” inside tumors that some researchers believe feed the growing tumor.
Various methods have been developed for identifying where a tumor is and how it utilizes connective tissue like blood vessels to sustain its growth, but, until recently, little has been understood about what kinds of signals tumors use to achieve this. To address this question, Gamble and her colleagues use TOF-SIMS to blast nanoscale regions of a tumor so parts leave the sample and enter a mass spectrometer. This device then separates and counts molecules based on their molecular weight.
Find your dream job in the space industry. Check our Space Job Board »
Scanning areas of 800 nanometers or less, the approach generates a map for where any particular molecule is present in a tumor sample. One square millimeter is reported to take about an hour and a half to map.
The group tested their technique on an inducible mouse model of pancreatic neuroendocrine tumorigenesis that is well-established as a model for studying the interaction between oncogenes and tumor suppressors, which together generate highly aggressive cancers.
When mapped, the mouse tumor microenvironments showed significant changes in metabolism. The ToF-SIMS technique was able to identify alterations to the normal flow of a wide variety of molecules ranging from larger lipids and nucleotides down to single ions.
Next, Gamble and her group plan to use their technique on earlier time-points of tumor induction in an attempt to chart out a series of chemical signals that tell the story of pancreatic tumor growth.
“We’re also looking to see if the there’s cross-talk between tumors,” Gamble said. “We would like to identify the molecules that could both initiate and maintain tumor growth.”
Provided by:
American Institute of Physics
More information:
Blake M. Bluestein, Fionnuala Morrish, Daniel J. Graham, Li Huang, David Hockenbery, Lara J. Gamble. Analysis of the Myc-induced pancreatic β cell islet tumor microenvironment using imaging ToF-SIMS. Biointerphases (2018). DOI: 10.1116/1.5038574
Image:
In this image, an islet tumor region shown with normal staining and with the time-of-flight secondary ion mass spectrometry. Fatty molecules appear in red, iron and other blood-related components are green, and surrounding tissue is blue.
Credit: Dan Graham and Blake Bluestein
